
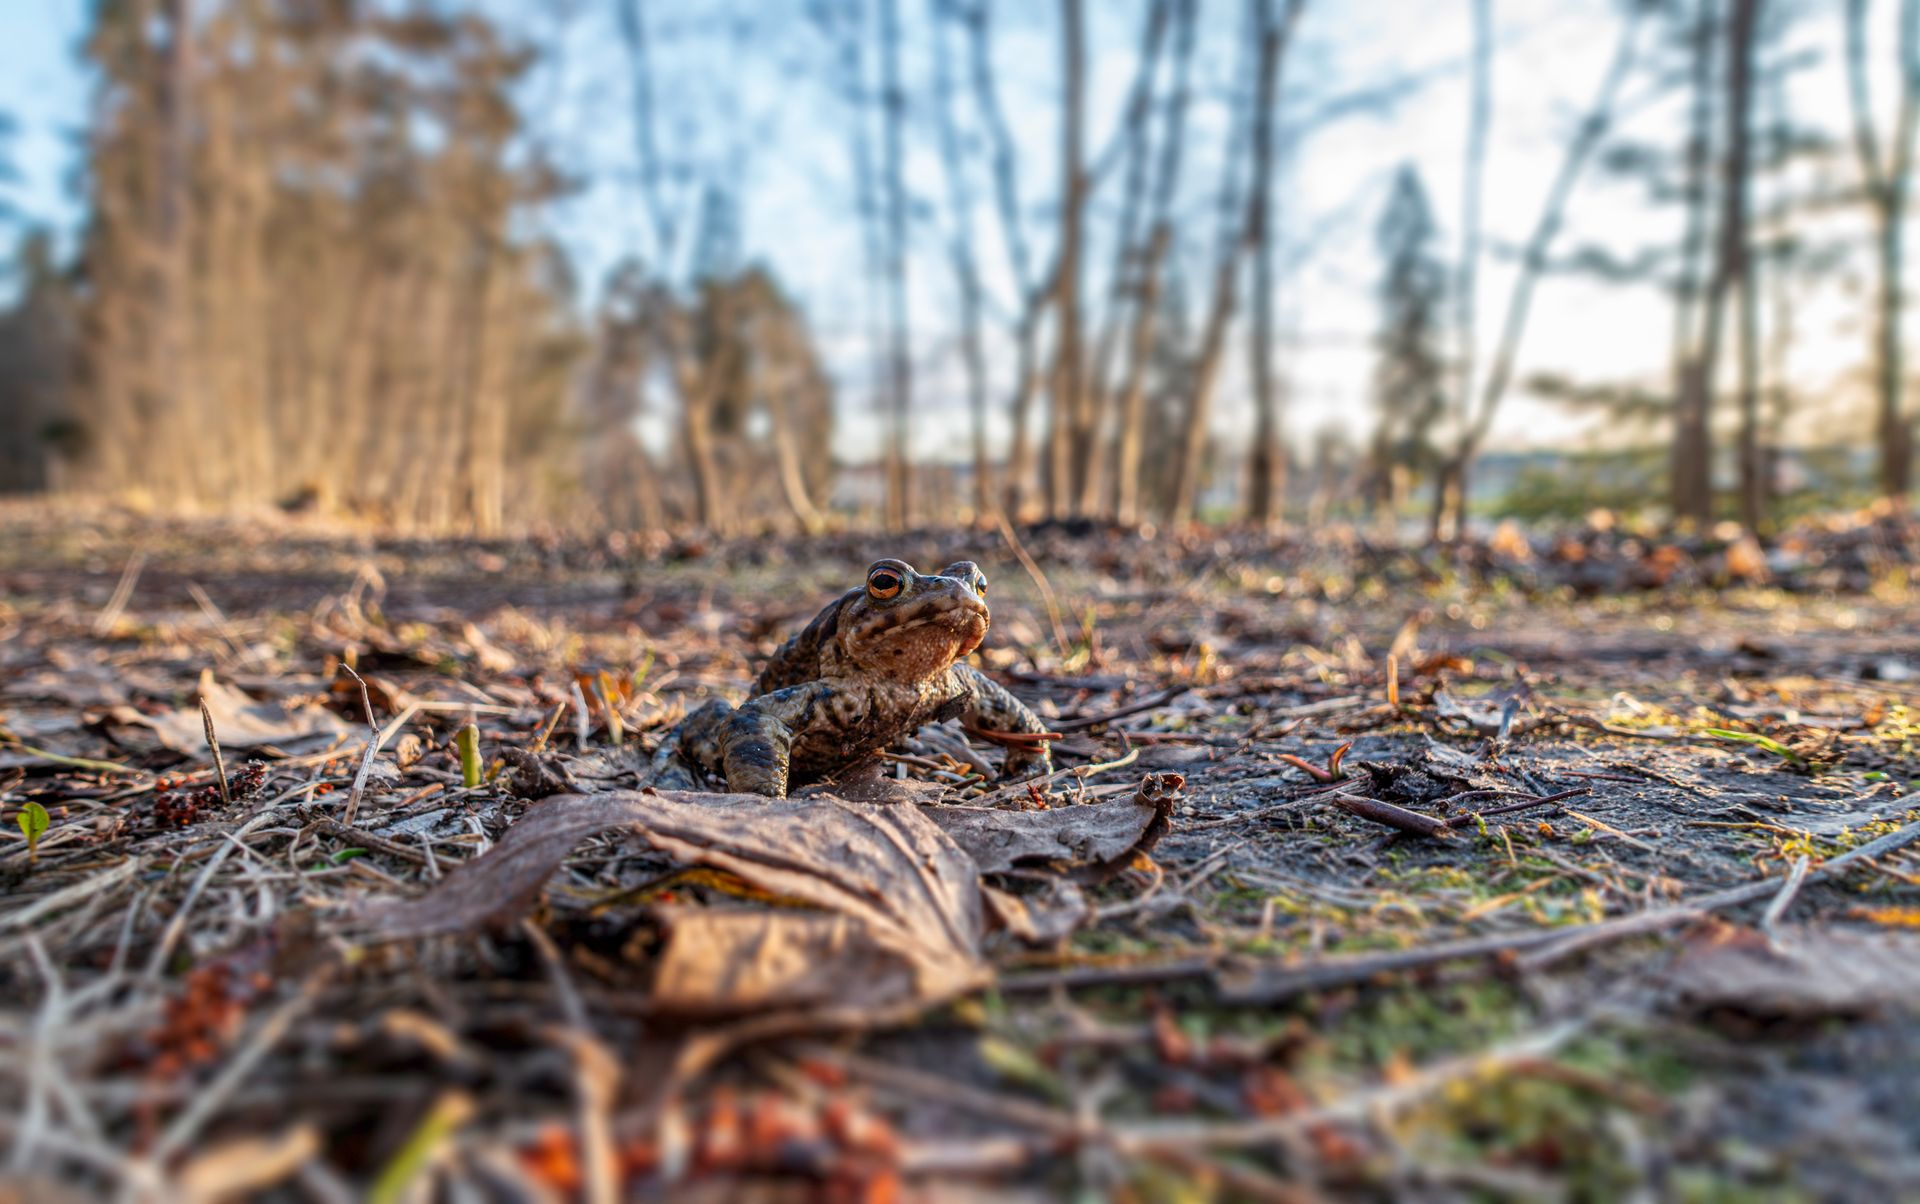
Afrobatrachia is a unique group of frogs that have evolved over time to thrive in the diverse environments of Africa. They are a distinct lineage that diverged from other frogs around 100 million years ago.
Their evolutionary history is characterized by adaptations to various habitats, from forests to grasslands and deserts. These frogs have developed distinct physical and behavioral traits to cope with the challenges of each environment.
Afrobatrachia's evolutionary journey has led to the development of a wide range of species, with some being specialized to live in specific areas.
Methods
To study Afrobatrachia, researchers employ a combination of field observations and laboratory analysis.
Field observations involve collecting data on the behavior, habitat, and population dynamics of Afrobatrachia species in their natural environments.
The data collected from field observations is then used to inform laboratory studies, which involve analyzing tissue samples and genetic material to gain a deeper understanding of Afrobatrachia's evolutionary history and relationships with other organisms.
Laboratory analysis also helps researchers identify the genetic mutations that have contributed to the unique characteristics of Afrobatrachia.
Researchers use a variety of techniques, including PCR (polymerase chain reaction) and DNA sequencing, to analyze the genetic material of Afrobatrachia species.
These techniques allow researchers to identify specific genetic markers and study the genetic diversity of Afrobatrachia populations.
Studying Afrobatrachia in both its natural and laboratory settings provides a comprehensive understanding of this unique group of organisms.
Phylogenetic Analysis
Phylogenetic analysis is a crucial step in understanding the relationships between different species, including those within the Afrobatrachia group. This analysis was conducted using maximum likelihood (ML) and Bayesian inference (BI) methods.
The researchers used the RAxML and MrBayes5D software packages to analyze the data, with the best substitution models estimated using Kakusan4 and Aminosan. The rapid hill-climbing algorithm was used for ML searches, starting from 100 randomized maximum-parsimony trees.
The analysis involved evaluating support for internal branches using bootstrap percentages (BP) from 1000 non-parametric replicates for ML and posterior probabilities (BPP) for BI. This approach helped identify the most likely relationships between the different species.
Results
The results of the phylogenetic analysis revealed some fascinating insights into the genetic makeup of certain species.
Extensive reorganization of mt genomes was found in three out of the four afrobatrachians analyzed, with Breviceps having the largest known mt genome among vertebrates.
This reorganization included duplicated and rearranged genes, with a notable pattern of non-tandemly copied genes situated within tandemly-copied regions.
The existence of concerted evolution was observed between non-neighboring copies of triplicated 12S and 16S ribosomal RNA regions.
Substitution rates in neobatrachian mt genomes were found to occur more rapidly than in archaeobatrachians.
Nucleotide substitution in neobatrachian mt genomes was particularly rapid in protein-coding genes due to a relaxation of purifying selection in the ancestral lineage of neobatrachians.
The substitution rates of most ranoid mt genes were significantly faster than those of non-ranoids.
In fact, almost all mt genes of natatanurans and afrobatrachians had significantly faster substitution rates than those of non-ranoids.
However, microhylid and non-ranoid neobatrachian mt genes showed no significant substitution rate heterogeneity, except for the transfer RNA genes.
DNA Sequencing
DNA sequencing is a crucial step in phylogenetic analysis, and it's fascinating to see how it's done.
The researchers used the primer-walking method to sequence the whole mt genomes of the four afrobatrachians, employing an ABI 3130xl automated DNA sequencer with the BigDye Terminator Cycle Sequencing Kit.
To sequence long tandem repeats and/or mononucleotide tracts, they used the TOPO TA Cloning Kit to subclone PCR fragments into E. coli vector pCR-2.1 or pCR-XL.
A series of deleted subclones was made from the resultant subclones using the Exonuclease III deletion method to precisely sequence the long tandem repeats.
The resulting mt gene sequences were identified by comparison with corresponding gene sequences from other vertebrates.
The researchers also looked for conserved sequence blocks 1, 2, and/or 3 (CSB I–III), characteristic elements of vertebrate CRs that are essential for the synthesis of D-loop DNA and for H-strand replication.
They identified many possible pseudogenes based on their lengths and sequence similarity to their corresponding functional paralogs.
Phylogenetic Analyses
Phylogenetic analysis is a complex process, but I'll break it down for you in simple terms.
Phylogenetic analyses were performed on both nucleotide (Nuc) and amino acid (AA) anuran datasets using maximum likelihood (ML) and Bayesian inference (BI) methods.
To determine the best substitution models, the AIC (Akaike information criterion) was used for ML analyses, while the Bayesian information criterion (BIC) was used for BI analyses.
The rapid hill-climbing algorithm was used for ML searches, starting from 100 randomized maximum-parsimony trees.
Bootstrap percentages (BP) from 1000 non-parametric replicates were used to evaluate support for internal branches in ML analyses.
Posterior probabilities (BPP) were used to evaluate support for internal branches in BI analyses.
Here are the different phylogenetic methods used in this study:
The phylogenetic analyses were performed on 36 OTUs (operational taxonomic units) using RAxML v.7.0.3 and MrBayes 5D software.
The results of the phylogenetic analyses were used to inform the rest of the study, including the identification of gene rearrangements and the estimation of divergence times.
Genome Analysis

In afrobatrachian mt genomes, duplications of CRs are often observed, and the copied CRs are highly similar to one another, with similarities of 99.0% across 3,148 comparable bp in Breviceps.
These strong nucleotide similarities of multiple CRs may be maintained by sequence homogenization mechanisms, also known as concerted evolution. The copied CRs in afrobatrachian mt genomes had very similar sequences, with 99.6%/1,857 bp in Hyperolius and 99.7%/1,390 bp in Trichobatrachus.
Two distinct concerted evolution mechanisms have been suggested: homologous recombination and illicit DNA replication accompanied by nascent strand slippage and a loop out of an extra-copied region. Homologous recombination seems to cause the concerted evolution in afrobatrachian mt genomes.
Non-neighboring copies of the tandemly triplicated segments in Breviceps mt genome have very high nucleotide similarity, with 98.5%/1,197 bp between copies 1 and 3.
Data and Sampling
The detailed information on taxa and genes used in this study is given in Additional file 1.
We assessed archived specimens that were collected as early as 1905, which is earlier than in previous studies that were archived in the Museum of Comparative Zoology at Harvard University.
Bd samples in our study come from two sources: previous studies and our own sampling effort, which includes individuals from field work in Cameroon between 2016 and 2019.
Data Availability
Detailed information on taxa and genes used in this study is given in Additional file 1.
The full sequence data are available in Additional file 2.
The aligned datasets (Nuc- and AA-datasets) used for phylogenetic tree reconstructions are available in Additional file 3.
Sequence data and setting files for the molecular dating analysis are available in Additional file 4.
The afrobatrachian OL regions and possible gene rearrangement pathways leading to the afrobatrachian WN–OL–ACY trn cluster are illustrated in Additional file 5.
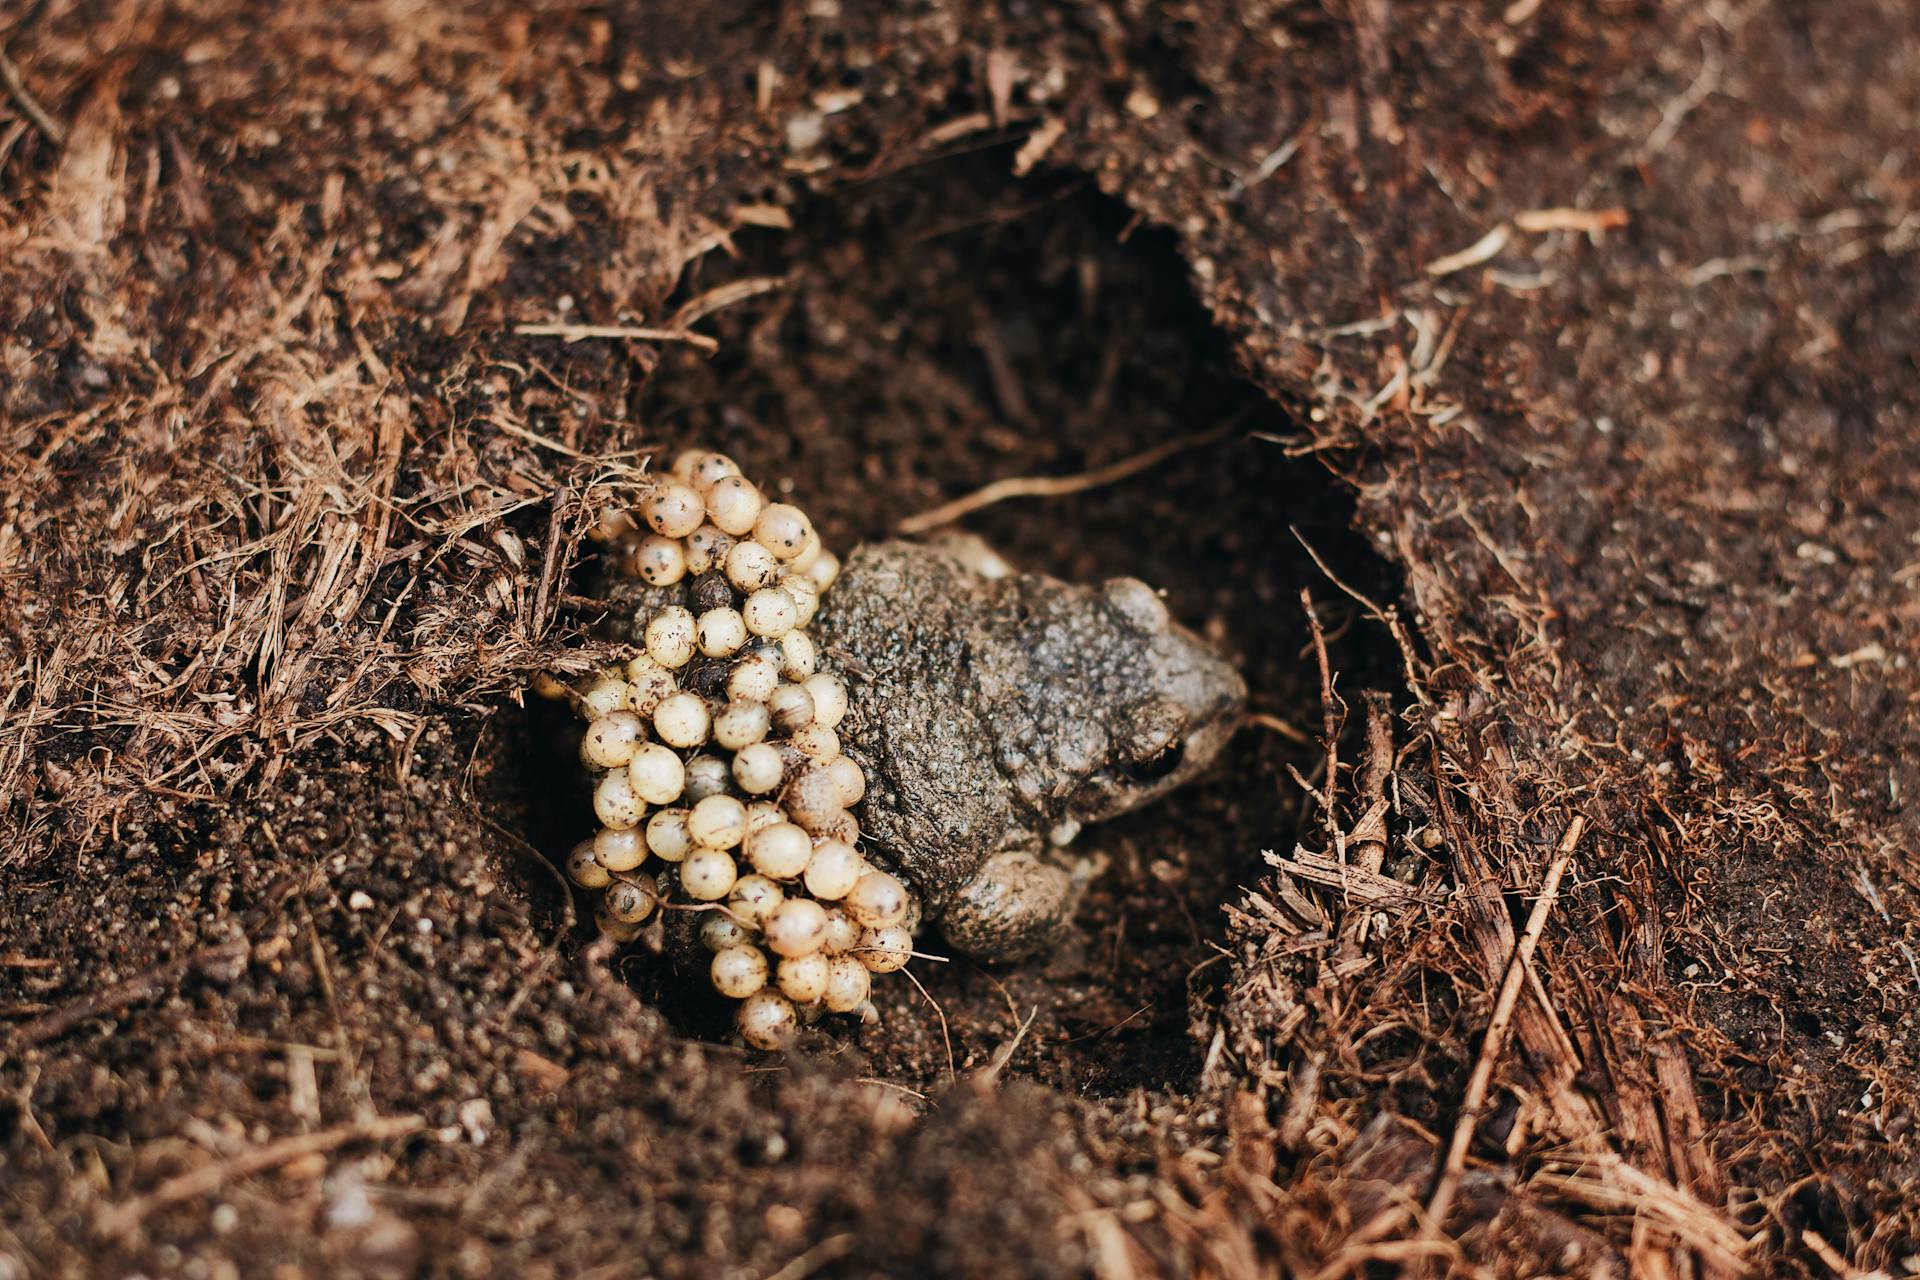
Sampling Timeframe of Amphibian Specimens Investigated for Bd
The sampling timeframe of amphibian specimens investigated for Bd is quite extensive.
The oldest data comes from archived museum specimens collected as far back as 1905.
Our own sampling effort took place over four consecutive years, from 2016 to 2019.
Field work was conducted at 18 localities in Cameroon during this time.
Sampling occurred between May and August each year, with most localities visited at least twice.
Frog sampling was done at night, often involving opportunistic searches near streams and ponds, as well as occasionally overturning logs and rocks.
Caecilian sampling, on the other hand, took place during the daytime, primarily through digging in soil using a hoe.
Amphibian specimens obtained during field work include frogs and caecilians, which are preserved and curated at the Florida Museum of Natural History.
Host and Environmental Factors
Host identity plays a significant role in determining the prevalence of Bd in Afrobatrachia.
At montane sites, certain amphibian genera like Crotaphatrema and Wolterstorffina have higher prevalence of Bd.
The genus Afrixalus has a higher Bd burden in recent sampling between 2017-2019.
Host effects in lowlands are stronger than at montane sites, with frogs like Cardioglossa, Kassina, and Leptodactylodon having higher prevalence of Bd.
Cardioglossa consistently shows a pattern of disproportionately higher Bd prevalence, particularly in recent sampling.
Environmental factors also shape Bd prevalence, with precipitation variables having a stronger effect than temperature-related variables.
Variables associated with precipitation, such as BIO14 and BIO16, have a significant impact on pathogen burden.
BIO14 is associated with a decrease in Bd prevalence, while BIO16 increases it.
Isothermality (BIO3) is the only temperature-related variable with an impact on Bd, and it's associated with a decrease in infections.
Elevation and latitude are both significantly associated with an increase in infections.
Higher elevation and latitude are linked to higher odds of infection, while precipitation of the warmest quarter is associated with lower odds of infections.
Evolutionary Analysis
Afrobatrachia's evolutionary history is a complex and fascinating topic. Phylogenetic analyses have been used to study the relationships between different species within this group.
Maximum likelihood and Bayesian inference methods were used to analyze the genetic data, with the best substitution models estimated using Kakusan4 and Aminosan. The rapid hill-climbing algorithm was used to optimize the substitution model parameters in RAxML, while Markov chains were run in MrBayes5D to sample the posterior distribution.
Concerted evolution mechanisms, such as homologous recombination and illicit DNA replication, have been suggested to explain the high nucleotide similarity between duplicated CRs in afrobatrachian mt genomes. The similarity between non-neighboring copies of the tandemly triplicated segments in Breviceps mt genome suggests that homologous recombination is the mechanism responsible for concerted evolution in this group.
The evolution of terrestrial development in anurans is a key aspect of Afrobatrachia's biology. Direct development is associated with the loss of many larval features, but this does not mean that the tadpole is completely excised from the ontogeny of direct developing frogs.
Molecular Dating Analysis
Molecular dating analysis is a powerful tool for estimating the divergence times of species. It uses a Bayesian dating method, with a soft-bound approach for age constraints and Cauchy distribution for lower-bound constraints.
The researchers used the program MCMCTree, implemented in PAML 4.6, to perform this analysis. This program is particularly useful for its ability to handle large datasets and multiple calibration points.
They applied independent GTR + Γ models to each of the seven data partitions, which were used to analyze the full Nuc-dataset of 46 OTUs. The tree topology from their phylogenetic analysis was also used as input.
Seven calibration points were suggested from fossil records as priors for divergence time estimations. These points included the Sauropsida-Synapsida split, which was estimated to be greater than 312 million years ago.
The researchers used a Cauchy distribution with default parameters to model the uncertainty in the calibration points. They ran the Markov chain for 11 million generations, sampling every 100 generations.
The first 1 million generations were discarded as burn-in, and the remaining samples were used to estimate the posterior ages of the calibration nodes. Chain convergence and adequate effective sample sizes were checked using Tracer.
A cross-validation analysis was performed to test which molecular clock model was most suitable for the data. The correlated clock model had a smaller total standard error than the independent clock model.
Prepare sequence datasets for evolutionary analysis
Phylogenetic analyses require a solid foundation in sequence datasets. The Nuc and AA anuran datasets (36 OTUs) were analyzed using maximum likelihood (ML) and Bayesian inference (BI) methods.
To begin, you'll need to select the best substitution models for your nucleotide and amino-acid partitions. Kakusan4 and Aminosan were used to estimate the best substitution models for the nucleotide and amino-acid partitions, respectively.
Phylogenetic analyses often involve comparing many different substitution models. The AIC was used for ML analyses, while the Bayesian information criterion (BIC) was used for BI analyses to select the substitution models.
To ensure accurate results, it's essential to check for convergence in your phylogenetic analyses. Convergence was checked a posteriori using Tracer v.1.5, and the first 10% of generations were discarded as burn-in to prevent sampling before the Markov chains reached stationarity.
Phylogenetic analyses can be computationally intensive, so it's helpful to optimize your approach. The rapid hill-climbing algorithm was used for ML searches in RAxML, which independently optimized all substitution model parameters in all partitions.
Phylogenetic analyses often involve evaluating support for internal branches. Bootstrap percentages (BP) from 1000 non-parametric replicates were used for ML, while posterior probabilities (BPP) were used for BI to evaluate support for internal branches.
To prepare sequence datasets for evolutionary analysis, you'll need to ensure they're accurately sequenced. Whole mt genomes were PCR-amplified and sequenced using an ABI 3130xl automated DNA sequencer.
Sequencing long tandem repeats can be challenging, but there are strategies to overcome this. The primer-walking method was employed for sequencing, and subcloning was used to sequence long tandem repeats using the TOPO TA Cloning Kit.
To identify conserved sequence blocks and pseudogenes, you'll need to compare your sequences to known sequences. Conserved sequence blocks 1, 2, and/or 3 (CSB I–III) were identified in vertebrate CRs, and pseudogenes were identified based on their > 40 bp lengths and > 50% sequence similarity to their corresponding functional paralogs.
Sequencing multiple genes can be time-consuming, but it's essential for evolutionary analysis. The newly determined mt and nuclear sequences were deposited in the DDBJ/EMBL/NCBI DNA databases.
When comparing substitution rates across different lineages, you'll need to account for potential biases. The relative rate test was used to compare substitution rates of mt genes within five alignment categories (all mt genes, all mt protein-coding genes, 12S rrn, 16S rrn, and all trns) of four neobatrachian lineages.
Concerted Evolution Mechanism
Concerted evolution is a mechanism that helps maintain similar sequences in copied regions of animal mt genomes. In afrobatrachian mt genomes, duplicated CRs are often highly similar to one another.
The strong nucleotide similarities of these multiple CRs may be maintained by sequence homogenization mechanisms. For example, in the Breviceps mt genome, the copied CRs have very similar sequences, with 99.0% similarity across 3,148 comparable bp.
Two distinct concerted evolution mechanisms have been suggested: homologous recombination and illicit DNA replication accompanied by nascent strand slippage and a loop out of an extra-copied region. The illicit replication process seems to be less effective at homogenizing non-neighboring copies.
Homologous recombination appears to be the mechanism responsible for concerted evolution in afrobatrachian mt genomes, at least in copies 1 and 3 of the triplicated segments in Breviceps. This is because the illicit replication process cannot easily homogenize non-neighboring copies.
Evolution of Anuran Development
The evolution of anuran development is a complex and fascinating topic. Direct development in frogs and toads is becoming increasingly common in certain lineages, including the sub-Saharan frog family Arthroleptidae.
In these species, the trend is towards terrestrial reproduction, which is a departure from the typical aquatic reproduction of most frogs and toads. The African Squeaker frogs, Arthroleptis wahlbergii and A. xenodactyloides, are examples of direct developing frogs.
Direct development is associated with the loss of many larval features, but this doesn't necessarily mean that the tadpole is completely excised from the ontogeny of direct developing frogs. In fact, research suggests that the tadpole is an evolutionary meta-module composed of many different developmental sub-modules.
Different combinations of these sub-modules seem to underlie the evolution of direct developmental patterns in distantly related frogs. This indicates that a complete terrestrial development might have evolved in different ways.
Here are some examples of direct developing species and their characteristics:
Metamorphic changes in direct developing frogs seem to correlate with thyroid gland activity, challenging the idea that the tadpole is a module that can either appear or disappear during evolutionary development.
Featured Images: pexels.com


